Students’ perceptions of math as a subject, themselves as math learners, and math learning in their classroom.
Use this measure:
Access a copy of the CVNIC Student Mindset Survey
Measure of...
Measurement instrument overview
This student survey consists of 10 items, organized into 6 conceptual clusters. It takes about 3 minutes for students to complete the survey; about 5 minutes should be allocated to administer the survey.
Connection to student learning
Survey items are designed to capture students’ perceptions of their math classrooms and attitudes about math learning that research indicates make a difference for student learning. The six conceptual clusters are as follows:
- Fixed or growth mindset for learning math
- Math is boring
- Math enjoyment
- Sense of belonging
- Relationship between solving math problems and being good at math
- What is needed to be successful in math class
Data from this survey can be used to support
- Teachers, as they inquire about aspects of student mindset that research suggests matter for mathematics learning
- Instructional leaders (e.g., mathematics coaches, district math leaders), as they identify areas in which to provide teacher support
- All users, as they identify whether targeted changes to their math practice are resulting in improvements in students’ perceptions
What we know about how well this measure works for its intended use
To develop the survey, a group of improvement coaches and Tulare County (California) educators selected important ideas about student mathematics learning from a professional learning experience that Tulare County educators attended. The professional learning was offered by Dr. Jo Boaler; it was about her supplemental mathematics program for students called Week of Inspirational Math (or iMath), which focuses on building students’ positive feelings about and conceptual understanding of math. Together, the group crafted survey questions related to the program. They then administered the surveys to students across the network prior to and after students’ participation in the program. Some items were reworded in subsequent years to elicit more meaningful results. An item from the Practical Measures, Routines, and Representations (PMRR) discourse survey (also included in this repository) was added at a later stage.
The Student Mindset Survey was also predictive of student math achievement on the state summative achievement (CAASPP) test.
It is important to note that the group from Tulare developed the CVNIC Student Mindset Survey to be used in conjunction with the district’s use of the iMath student learning program. However, the survey questions may also have value for educators not implementing the iMath program.
Frequency
The survey was administered three times per year: at the start of the school year, about a month into the school year after their participation in iMath, and then later in the winter (February).
Measurement routine details
Survey administration occurred via Airtable forms, an online platform that allows users to electronically collect and log data. Data were cleaned to delete duplicate information and identify students who had not yet taken the survey so they could be provided a second opportunity to take it. Data were analyzed by an internal CVNIC analyst who produced data reports for teachers. CVNIC leaders guided teachers through their data at network meetings, using the Ladder of Inference data discussion protocol, which involves encouraging teachers to review the data without jumping to conclusions. Teachers were asked to complete their review of the data to identify a problem they would like to further investigate and come up with some possible change ideas to test during an “action period.”
Data analysis differed somewhat in the earlier versus the later years of the network. In later years, as the network learned from their earlier experiences, they added staff with more analytic capacity, and they were able to offer teachers more sophisticated data reports.
Data analysis details
The Early Years: Graphic Representations of Data. In the early years of the CVNIC, each teacher received individual reports with bar graphs representing their class’s average responses in comparison to the average for the county. Teachers could compare their class’s responses across the different survey administrations or with results for the network, which includes other school sites and districts.
CVNIC improvement coaches performed additional analyses of the survey data, as illustrated in the charts below. Some of these analyses (mountain graphs, arrow graphs, order bar charts, and teacher dashboards) were incorporated as regular reports for teachers in the later years of CVNIC.
The arrow chart below represents changes across the entire network sample from time1 to time2 on each of the measure categories. The improvement coaches produced a similar chart to examine the change between time2 and time3.
![]()
A second type of data representation (shown in the two charts below) focused on changes in average scores for individual teachers’ classrooms over time. The first of the two charts below represents average teacher-level scores from time1, time2, and time3. The circled data on the top chart show average student results for an individual teacher (UU-s8) whose students scored relatively high on the Student Mindset Survey over all three periods. The second of the two charts below represents the standard deviations of the survey results by individual teacher. The circled data show a relatively low standard deviation across the three measurement periods for that teacher (UU-s8), indicating that students were generally in close agreement in their responses.
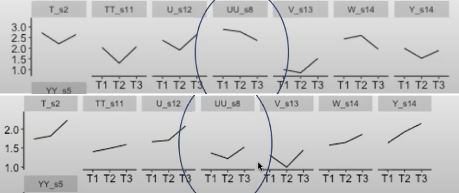
These data representations were used to identify teacher “bright spots.” Teachers identified as bright spots were interviewed and observed to understand some of the details of their math instruction.
The Later Years: Online Data System. With increased analytic capacity in later years, the network was able to organize the student survey data into an online system using Google Data Studio. A screenshot from the system is included below. This shows data for Question 2 for the entire network (CVNIC) and for all the teachers at one school (the first row represents all of CVNIC and each row underneath it represents data for one teacher). In the system, if you hover over a bar, it will pull up a summary of the data for a given teachers’ classroom (percentage of students who gave each response). In the upper right-hand corner of the screenshot are controls that allow a user to filter the data by district, school, or teacher. A teacher would simply need to know their unique ID number to find their own class data, or they could examine similar data for other (anonymous) teachers in the same grade level, school, or district.
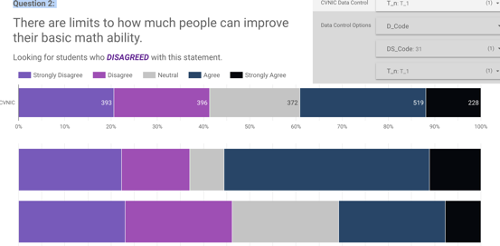
CVNIC leaders reported that shifting the presentation of data from static reports to an online system changed how teachers engaged with the survey data and better supported teacher inquiry. Teachers were able to use the new analysis system to dive into data on individual items and for their district, class, or individual students. The new data displays helped teachers focus their attention on what they were truly curious about and supported more targeted conversations among teachers about what, precisely, they were trying to improve. This focus allowed teachers to be more specific about the kinds of ideas they were testing.
Conditions that support use
- The survey was used within the context of an improvement network in which teachers were supported by local county office math specialist coaches and improvement coaches to make sense of their data and connect the data to improvement and instructional changes. County office math coaches received a year of improvement training from improvement coaches, and improvement coaches also supported the survey development and analysis.
- Prior to using the survey, all teacher participants were supported to participate in the professional learning opportunity with Dr. Boaler about student mindset. Coaches then spent time talking with teachers to build a common understanding of the survey items so that everyone would understand what the questions meant. This aligned the group around a common understanding of what it meant for student mindset to shift in a positive direction and allowed the group to make common interpretations from the data.
- Use of the survey enabled the network to grasp and appreciate collecting data for learning, as opposed to collecting data for compliance purposes. Teachers were generally less defensive about these data than about student achievement data. However, some teachers felt powerless to change student mindset, whereas they felt that they could improve students’ content understanding.
- Network leaders spent time building a “data culture” to support teachers to want to look at their data. They found that teachers were “hungry” to examine these data to learn from their students. Teachers felt like these were data they could act on right away, unlike summative achievement data.
- Survey items that were directly connected to concepts addressed through the iMath interventions were more likely to change from one survey admin to the next.
- The survey was only one of a system of measures. The county also had additional outcome measures, including the state summative student achievement scores and county-created common formative assessment (which focused on five central 5th grade content areas). The county also had some self-report survey data about supports provided within schools as well as a small amount of classroom observation data.
Challenges
- In later years of CVNIC, the analytic support for compiling and visualizing data better supported network members’ data investigations, discussions, and actions, compared to the earlier years.
Other tools and resources to support use
Some of CVNIC’s learning about the importance of mindset is available in a teacher-facing brief, Major Concepts of Growth Mindset, and in a longer report, CVNIC: A Rural Network Improvement Community’s Approach to Transforming Student Mindsets in Mathematics.
The CVNIC team used the Ladder of Inference data conversation protocol to guide teachers’ collective sensemaking conversations about the data.
The CVNIC organized as a network to improve instruction in Tulare County, California, a rural area of the state. The network formed to address a dip in student math achievement in 5th grade on the state summative assessment. CVNIC set an aim of tripling the success rates of students in 5th grade math by shifting teachers’ instruction to better support students’ mastery of the Common Core State Standards for Mathematics. In the early phase of the network, participants were mostly 5th grade teacher teams from 13 different districts. These teachers were supported by county office math specialists and external improvement coaches. In later years, the network expanded to include teachers in grades 3–8.
After attending a professional learning series by Dr. Jo Boaler on her Youcubed iMath project, teachers in the network wanted to use some of her ideas in their instruction. To help teachers track whether the integration of these new ideas shifted student mindsets, the group developed the CVNIC Student Mindset Survey and administered it to students at three time points over the course of each school year. CVNIC organized five network meetings per school year, with a “measure session” built into each meeting. The group planned which measures the entire network would look at and discuss during each meeting.
The Student Mindset Survey provided useful information because the data were used for learning more than for accountability. The survey data provided a feedback loop to teachers. An improvement coach reported that “this was the improvement measure [that teachers] liked the most — people were hungry to get to the network meetings and look at the data because the teachers cared about what their students said about the items.” The survey’s mindset measures were deemed “very important” and were discussed at every network meeting. The measures enabled CVNIC to focus attention on particular concerns or “dips” in the data from one time point to the next.
In the first year, network members identified a drop in average scores between the second and third administration of the survey, causing teachers to examine what was happening in their classrooms more closely between those time periods. Having these data also encouraged teachers to be more intentional the next year about incorporating the iMath instructional practices into their instruction during this period. Using the survey also created opportunities within the network to talk about teachers’ growth mindset, not just students’ growth mindset.
An analysis of consequential validity indicated that the Student Mindset Survey was predictive of student outcomes on the California Assessment of Student Performance and Progress (CAASPP). Ultimately, CVNIC’s measurement system (of which this survey was only a part) did not help the network understand the impact of their instructionally focused improvement ideas. They were not able to confirm whether the instructional changes that they tried took deep root or whether the changes did take root but did not produce the desired student achievement outcome.
CVNIC’s analytic capacity was a source of challenge during its early years because there was not a dedicated analyst to support this work. (For example, even combining data from multiple sources into a database took longer than needed because unique identifiers for participants were not used across data sources.) Additionally, CVNIC leadership suggested that, in retrospect, their process of developing the survey “from scratch” was less than ideal and resulted in items that did not cluster well (e.g., 10 items organized into 6 groups). It took some time to develop the routine through which the network was able to look at data during the network meetings so they could learn from the data.
Interviewees:
Kim Webb, Staff Development & Curriculum Specialist, Tulare County Office of Education
Christine Roberts, Staff Development & Curriculum Specialist, Tulare County Office of Education
Alicia Grunow, Improvement Specialist
Add a Comment